Hep C Calculator is an interactive tool developed to evaluate the cost-effectiveness of DAAs for the global treatment of Hepatitis C infection. The tool uses a mathematical model of multi-stage disease progression to simulate the life course of HCV-infected populations in 28 countries (considered as priority countries by the World Health Organization). The natural history of HCV calculated using this model has been validated with the results of a multicenter follow-up study of patients with advanced fibrosis. The tool allows users to select several input parameters – country, prices of DAAs and of laboratory tests, cost of management of HCV disease stages including sequelae (e.g., cirrhosis and liver cancer), and mean age and relative distribution of fibrosis stages for a given population.
Input and Output Panels
An input panel (on the left side) of the Hep C Calculator allows users to select a country, local prices of DAAs and of laboratory tests, annual cost of management of various HCV disease stages (health states), and some patient characteristics (average age and relative distribution of various fibrosis stages). The outcomes of two strategies – treatment with DAAs versus no treatment – are compared. In real-time, the user can evaluate the following outcomes for each strategy: total life-time healthcare costs (including the cost of DAA treatment and of downstream events such as liver cancer), quality-adjusted life years (QALYs), and the cumulative incidences of decompensated cirrhosis, liver cancer, and HCV-related deaths.
Using the health sector perspective, the incremental cost-effectiveness ratio (ICER) is used to determine whether the treatment of HCV with DAAs is cost-saving, cost-effective or neither. In addition, the Hep C Calculator provides ICER values over time, which can be used to determine the duration when DAA use will become either cost-saving or cost-effective.
Mathematical Model
The life course of HCV-infected populations is simulated through the use of a previously validated mathematical model, the Markov-based Analyses of Treatments for Chronic Hepatitis C (MATCH),1, 2 and utilized to determine the cost-effectiveness of DAAs.
Characteristics of Base Case Population
Our base case population included HCV-infected persons with a user-defined age (in years), distribution of HCV genotype (G1, G3, or G4), and METAVIR fibrosis score (no fibrosis [F0], portal fibrosis without septa [F1], portal fibrosis with few septa [F2], numerous septa without fibrosis [F3], or cirrhosis [F4]). On choosing a country, data on HCV genotype distribution and fibrosis distribution for the particular country, as extracted from the Polaris Observatory (http://polarisobservatory.org/), are fed into the Hep C Calculator. However, a user can also chose to manually change the patients’ mean age and the relative frequency of fibrosis distribution.
Treatment Regimens and Efficacy
The treatment regimen and duration are dependent on HCV genotype and fibrosis stage. Treatment efficacy, adverse events and premature treatment discontinuation rates for each treatment regimen are modeled on data from clinical trials of DAAs in treatment-naïve patients.3-6
Natural History of HCV Infection
The natural history of HCV infection and progression are defined as transition rates between Markov health states. Each patient starts in one of five METAVIR liver fibrosis states (F0–F4; as defined by the user’s input) (Figure 1), and can, at the end of each cycle (i.e., month), remain in the same state, die from background mortality, move into a higher fibrosis state, or progress to decompensated cirrhosis and/or HCC, or liver-related death. Patients in F0-F3 states who achieved SVR are assumed to be cured and to follow background mortality thereafter; however, those initially in F4 state who achieve SVR can progress to more advanced states (decompensated cirrhosis and hepatocellular cancer), albeit at a slower rate. Patients who fail to achieve SVR or who discontinue treatment are assumed to continue to progress over time at their baseline rate. Table 1 provides the base case values of transition probabilities, i.e. the probability of a person progressing from one health state to the other.
Figure 1: State-transition model schematic showing the natural history of hepatitis C virus infection.

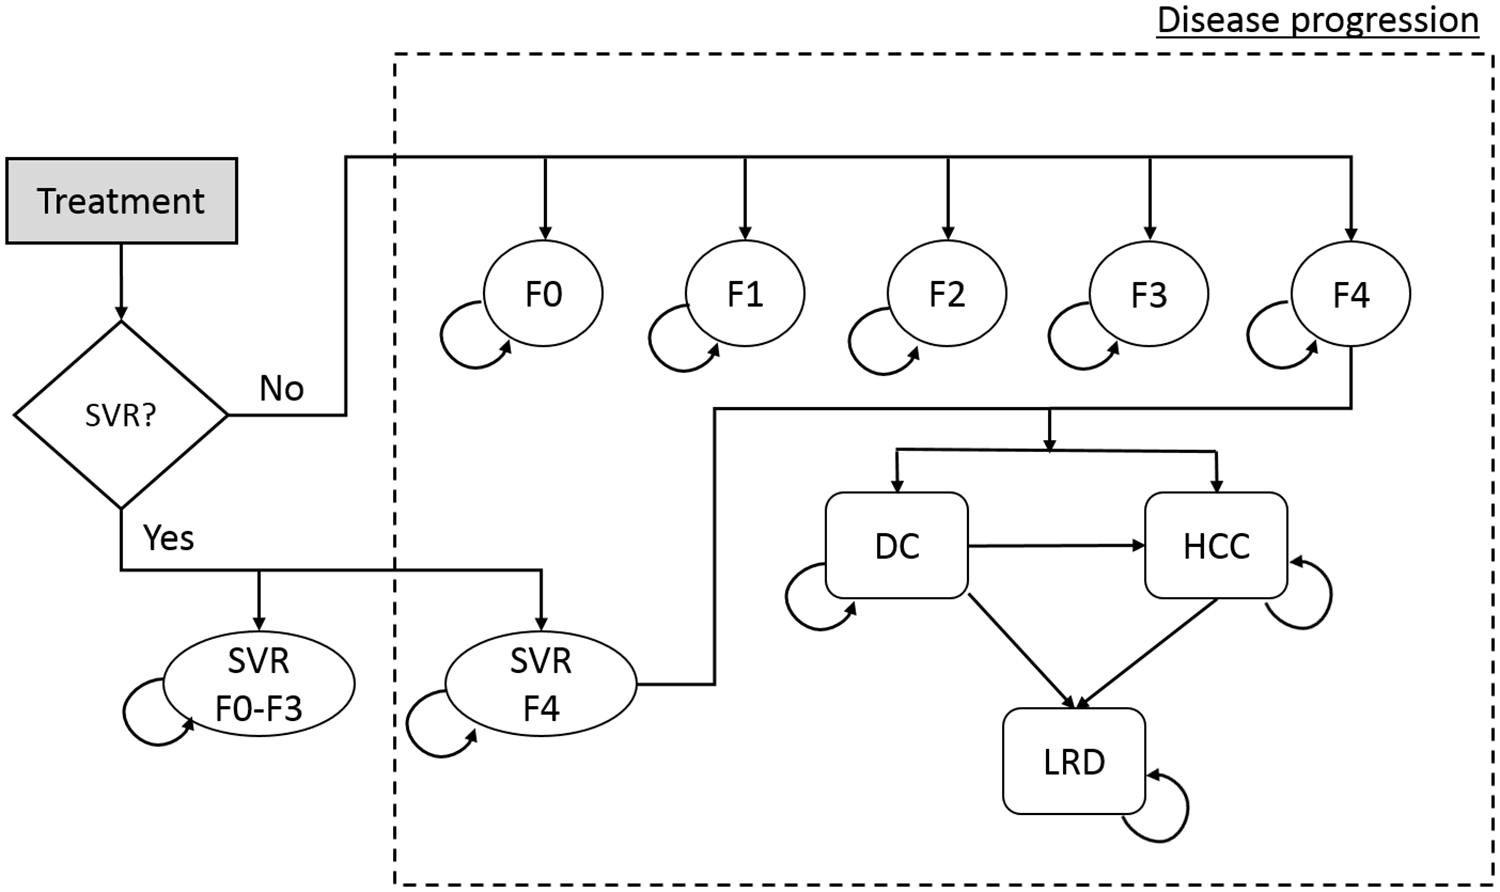
Abbreviations: DC = decompensated cirrhosis; HCC = hepatocellular carcinoma; HCV = hepatitis C virus; LRD = liver-related death; SVR = sustained virologic response; F0–F4 = METAVIR fibrosis score.
Table 1: Annual transition probabilities for different Markov states
| Transition probabilities (annual) | Base case |
|---|---|
| F0 to F1 7 | 0.117 |
| F1 to F2 7 | 0.085 |
| F2 to F3 7 | 0.120 |
| F3 to F4 7 | 0.116 |
| F4 to DC 8 | 0.039 |
| F4 to HCC 8 | 0.014 |
| Post F4-SVR to DC 9 | 0.008 |
| Post F4-SVR to HCC 9 | 0.005 |
| DC to HCC 10 | 0.068 |
| DC (first year) to death from liver disease 10 | 0.182 |
| DC (subsequent year) to death from liver disease 10 | 0.112 |
| HCC to death from liver disease 8 | 0.427 |
Abbreviations: SVR = sustained virologic response; F0–F4 = METAVIR fibrosis score; DC = decompensated cirrhosis; HCC = hepatocellular carcinoma; F4-SVR = post-SVR state of treated cirrhotic patient
Quality-of-life weights
The quality-of-life (QoL) weights for each health state are based on the disability weights (QOL = 1 – disability weight) as defined by the Global Burden of Disease study (0 for METAVIR scores F0–F4, 0.194 [range 0.127–0.273] for decompensated cirrhosis, and 0.508 [0.348–0.67] for HCC).11 We have used these standard weights for all countries.
References
- Chhatwal J, Kanwal F, Roberts MS, et al. Cost-effectiveness and budget impact of hepatitis C virus treatment with sofosbuvir and ledipasvir in the United States. Annals of Internal Medicine 2015;162:397-406.
- Aggarwal R, Chen Q, Goel A, et al. Cost-effectiveness of hepatitis C treatment using generic direct-acting antivirals available in India. PLoS One 2017;12:e0176503.
- Afdhal N, Zeuzem S, Kwo P, et al. Ledipasvir and sofosbuvir for untreated HCV genotype 1 infection. N Engl J Med 2014;370:1889-98.
- Nelson DR, Cooper JN, Lalezari JP, et al. All-oral 12-week treatment with daclatasvir plus sofosbuvir in patients with hepatitis C virus genotype 3 infection: ALLY-3 phase III study. Hepatology 2015;61:1127-35.
- Welzel TM, Petersen J, Herzer K, et al. Daclatasvir plus sofosbuvir, with or without ribavirin, achieved high sustained virological response rates in patients with HCV infection and advanced liver disease in a real-world cohort. Gut 2016.
- Kohli A, Kapoor R, Sims Z, et al. Ledipasvir and sofosbuvir for hepatitis C genotype 4: a proof-of-concept, single-centre, open-label phase 2a cohort study. Lancet Infect Dis 2015;15:1049-54.
- Thein H, Yi Q, Dore G, et al. Estimation of stage specific fibrosis progression rates in chronic hepatitis C virus infection: A meta analysis and meta regression. Hepatology 2008;48:418-431.
- Fattovich G, Giustina G, Degos F, et al. Morbidity and mortality in compensated cirrhosis type C: a retrospective follow-up study of 384 patients. Gastroenterology 1997;112:463-472.
- Cardoso AC, Moucari R, Figueiredo-Mendes C, et al. Impact of peginterferon and ribavirin therapy on hepatocellular carcinoma: incidence and survival in hepatitis C patients with advanced fibrosis. Journal of Hepatology 2010;52:652-657.
- Planas R, Ballesté B, Antonio Álvarez M, et al. Natural history of decompensated hepatitis C virus-related cirrhosis. A study of 200 patients. Journal of Hepatology 2004;40:823-830.
- World Health Organization, Geneva. "WHO methods and data sources for global burden of disease estimates 2000-2011." From: http://www.who.int/healthinfo/statistics/GlobalDALYmethods_2000_2011.pdf (last accessed December 22, 2016). 2013.